Published: Detecting Visual Function Loss After Acquired Brain Injury with Continuous Visual Stimulus Tracking
In Acta Ophthalmologica, Vrijling and colleagues show that SONDA tracking detects homonymous visual field loss after acquired brain injury regardless of the affected side, correlates with perimetry, and shows no learning effect. A research study, outside SONDA's cleared clinical use.
Acquired brain injury (ABI), most often a stroke, can leave a homonymous visual field defect: the same side of the field is lost in both eyes. Standard automated perimetry (SAP) is the reference test for mapping it, and it is hard to do well in exactly this group of patients, who may have difficulty with attention, concentration or responding reliably with a button. A study by Vrijling and colleagues from the University Medical Center Groningen and Royal Dutch Visio, now published in Acta Ophthalmologica, tested whether continuous visual stimulus tracking can detect and quantify that loss instead.
What Was Done
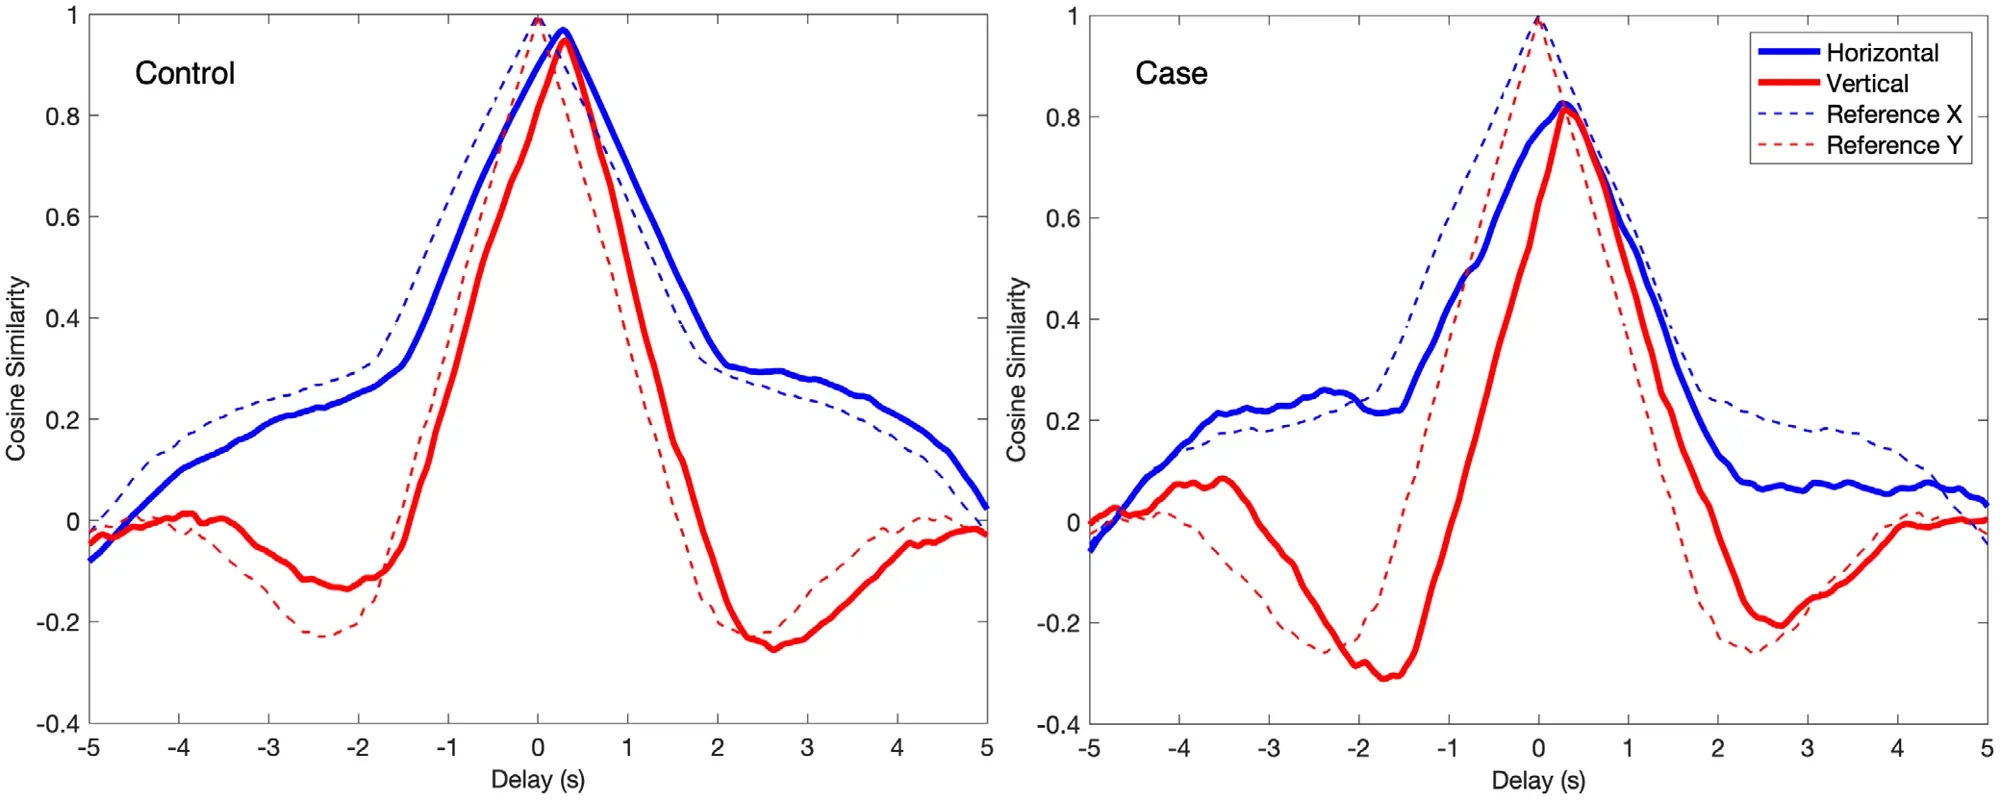
Patients with a unilateral ABI and a homonymous visual field defect, half with the defect on the left and half on the right, tracked a moving stimulus (Goldmann size III) at three contrast levels, 40, 160 and 640 percent, while their eye movements were recorded. Their tracking performance, the agreement between gaze and stimulus position, was compared with previously collected data from healthy controls and with their own SAP mean sensitivity. The test was repeated to check for a learning effect.
What Was Found
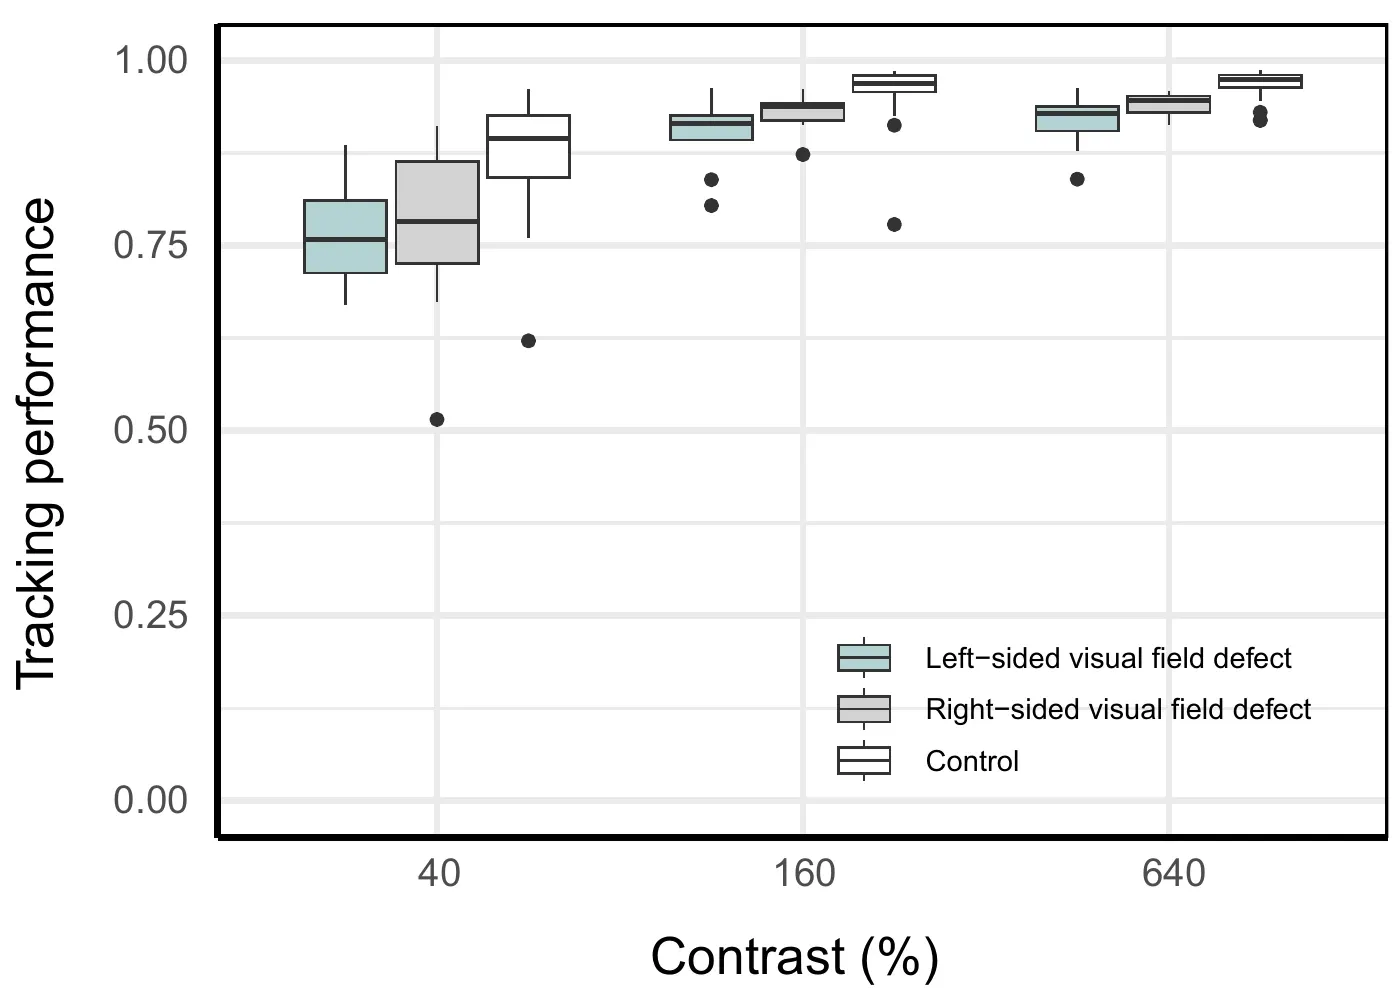
ABI reduced tracking performance at every contrast level, and the reduction did not depend on whether the defect was left-sided or right-sided. The cover figure shows the three groups side by side. Performance improved from 40 to 160 percent contrast and then plateaued: 640 percent added nothing.
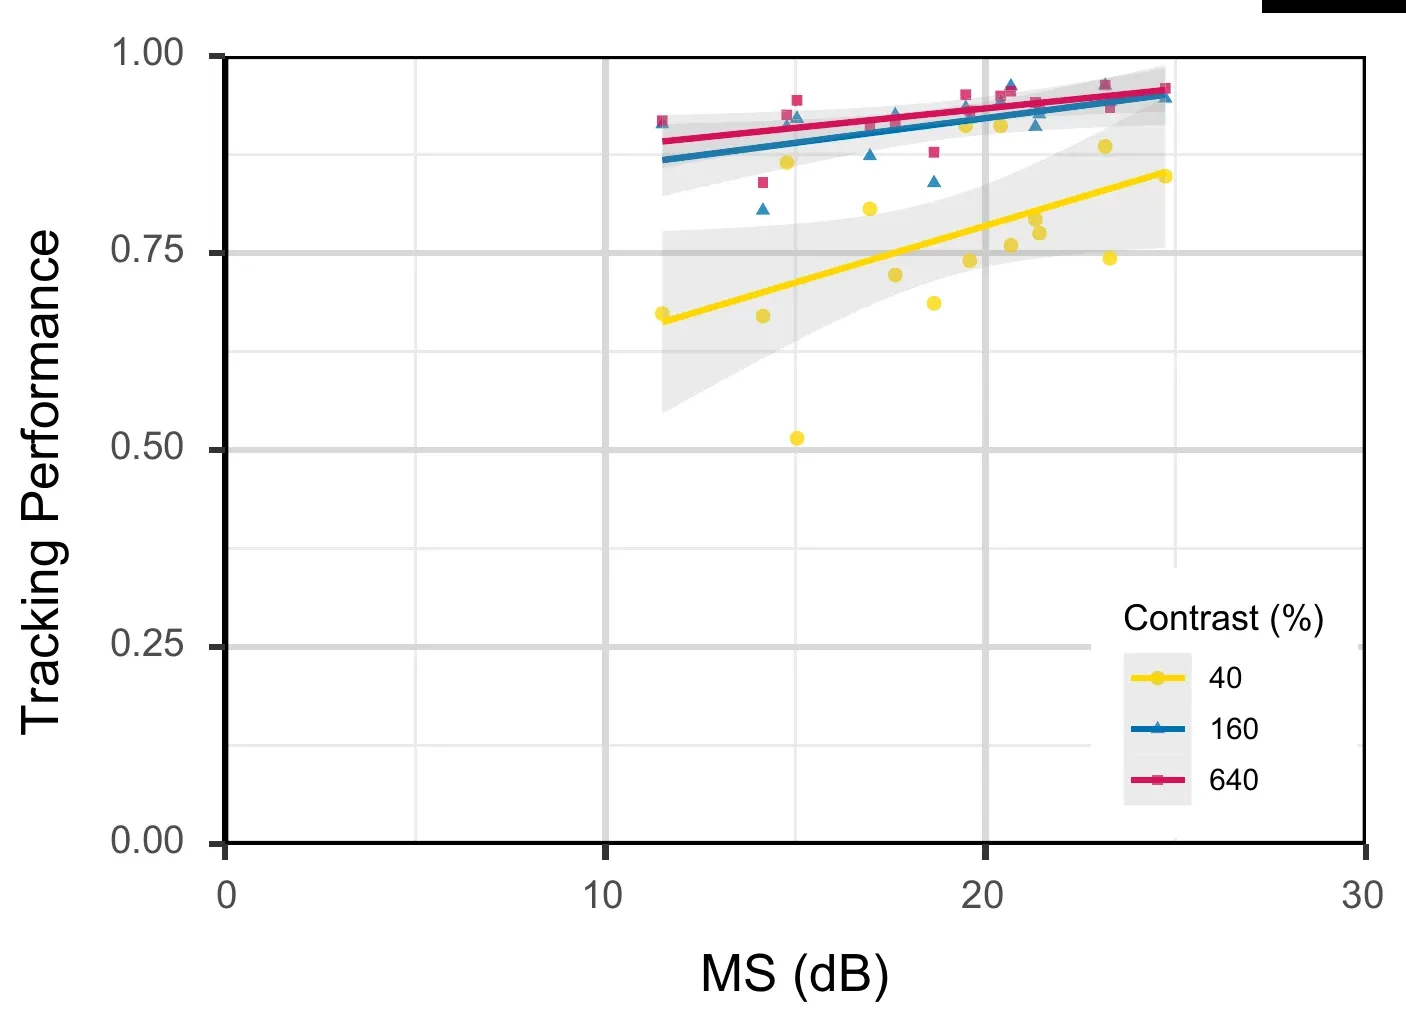
The amount of loss on SAP was reflected in tracking performance. At 160 percent contrast the correlation with SAP mean sensitivity was r = 0.73. Retesting showed no significant learning effect, a point that matters more in this population than in most, since any test that needs a practice run is at a disadvantage with patients who tire quickly.
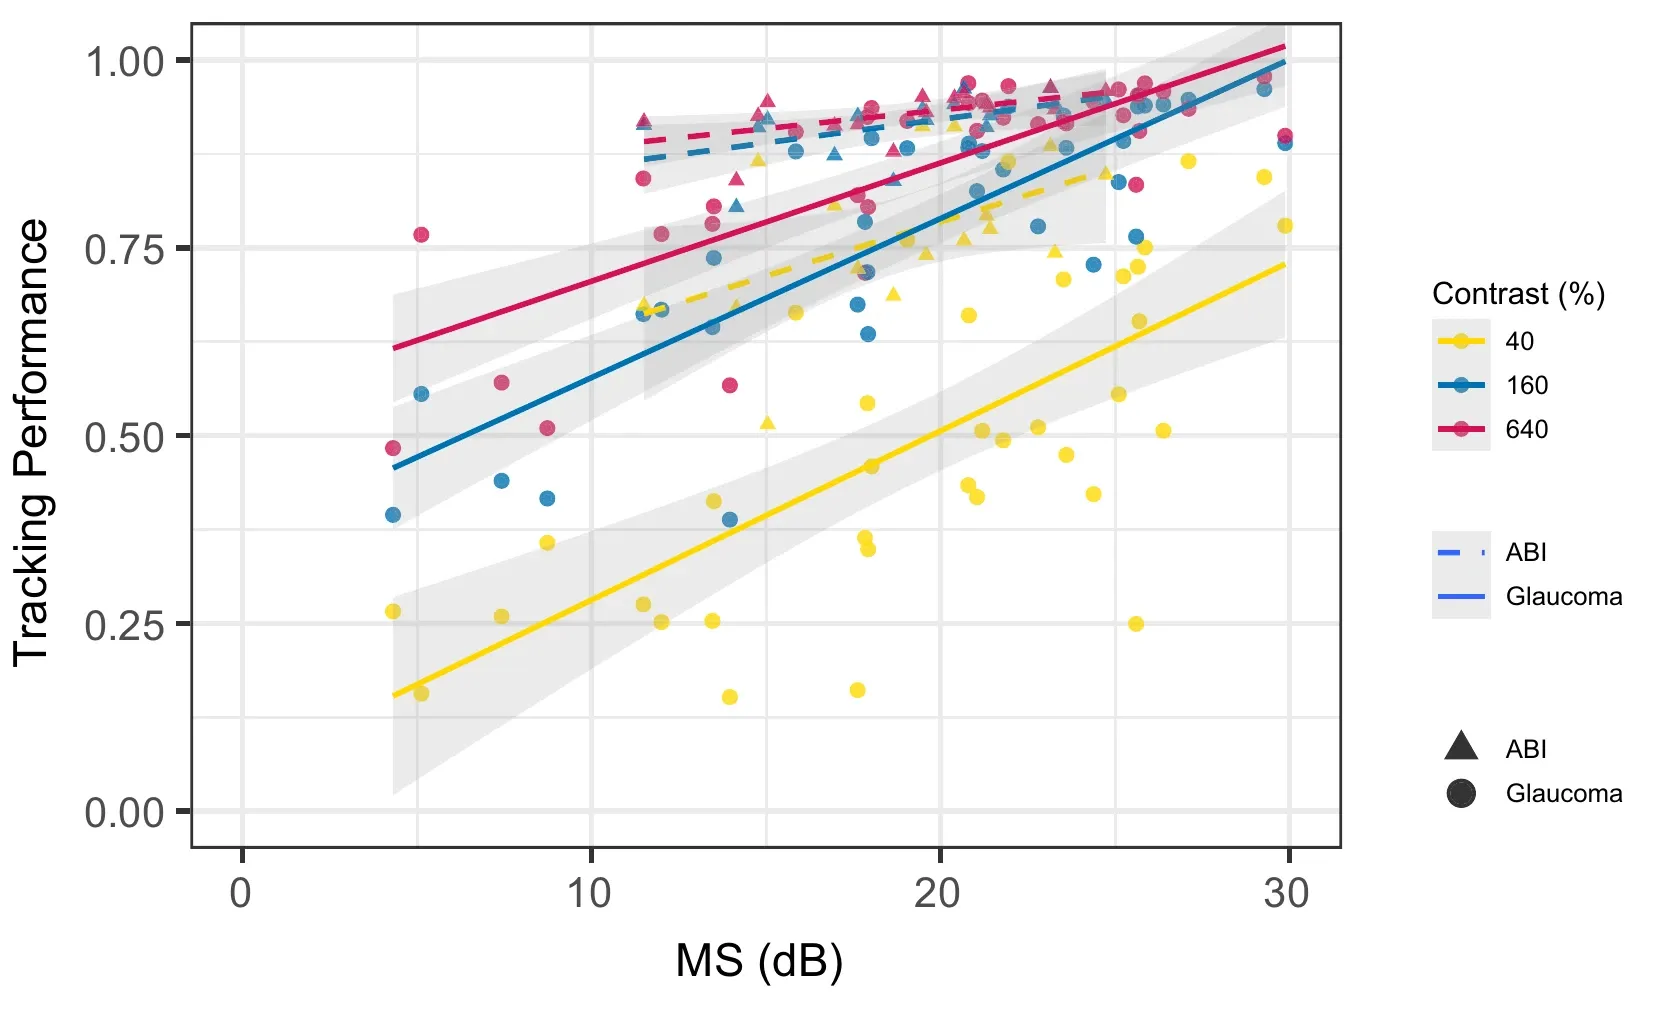
In the comparison with glaucoma patients of similar mean sensitivity (third gallery figure), the ABI cases tended to track somewhat better. The authors discuss compensatory scanning strategies and the different shape of homonymous defects as possible explanations.
What Comes Next
The authors conclude that tracking performance can detect visual function loss from ABI and that the reduction depends on the amount of visual field loss. The logical next steps they name are a larger validation study and the reconstruction of a visual field map from the tracking data. The method behind the study is described on the Digital biomarker page, and the paper is open access.
Research: applications other than glaucoma are under investigation and are not part of SONDA’s cleared clinical use. SONDA is CE-marked as an aid in the diagnosis and staging of primary open-angle glaucoma.
Reference
- Vrijling, A.C.L., de Boer, M.J., Renken, R.J., Marsman, J.B.C., Heutink, J., Cornelissen, F.W., Jansonius, N.M. (2025). Using continuous visual stimulus tracking for detecting visual function loss due to acquired brain injury. Acta Ophthalmologica, 104(4), e463–e474. doi:10.1111/aos.70048