Published: Eye Motility in Spinocerebellar Ataxia Type 3, Quantified with Continuous Visual Stimulus Tracking
In Frontiers in Neurology, de Boer and colleagues show that patients with SCA3 follow a moving target well but differently: with unsynchronised eyes and many small saccades, whose amplitude distribution tracks the severity of the oculomotor disorder. A research study, outside SONDA's cleared clinical use.
Spinocerebellar ataxia type 3 (SCA3) is the most common of the dominantly inherited cerebellar ataxias. Its oculomotor signs, with distance esotropia as the hallmark, often appear early and cause double vision. A study by de Boer and colleagues from the University Medical Center Groningen, now published in Frontiers in Neurology, used SONDA’s continuous visual stimulus tracking task to look at how these patients move their eyes, and whether the recordings contain measures that could serve as biomarkers of severity.
What Was Done
Genetically confirmed SCA3 cases performed the SONDA tracking task both with one eye and with both eyes open, and their eye movements were compared with previously collected recordings from healthy subjects. The task is the same as in the glaucoma studies: follow a target that moves smoothly and jumps, for a few minutes, with no further instruction.
What Was Found
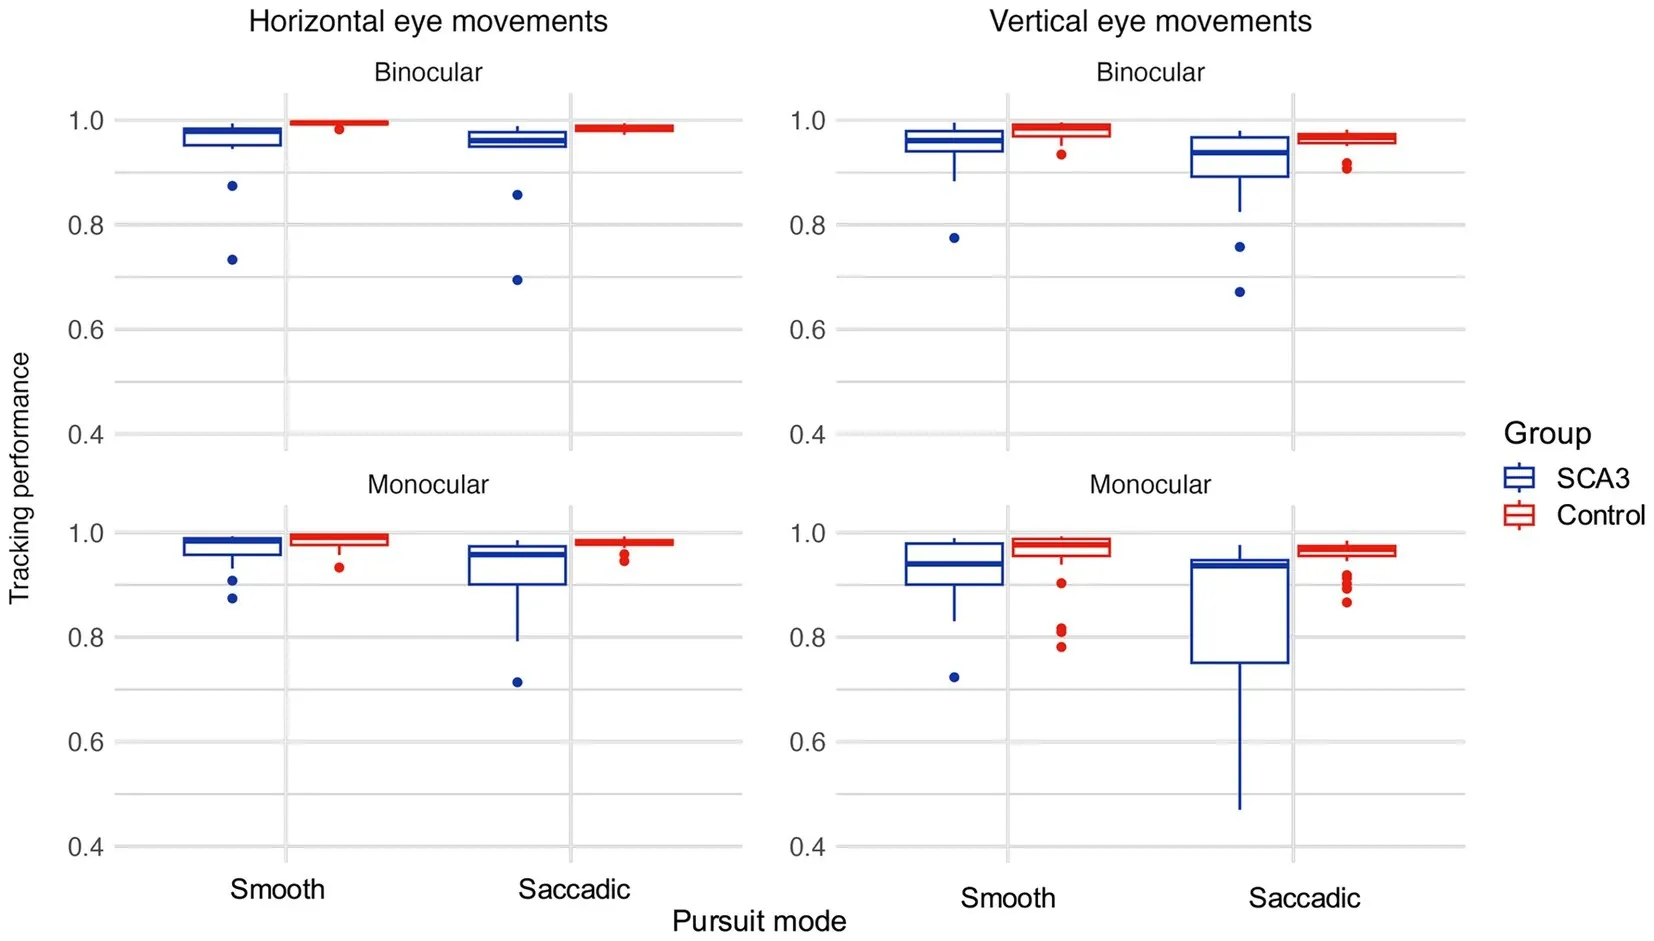
The patients could follow the target. Their overall tracking performance was high, only slightly below that of the controls, with the clearest reduction in the saccadic pursuit mode under monocular viewing (second gallery figure).
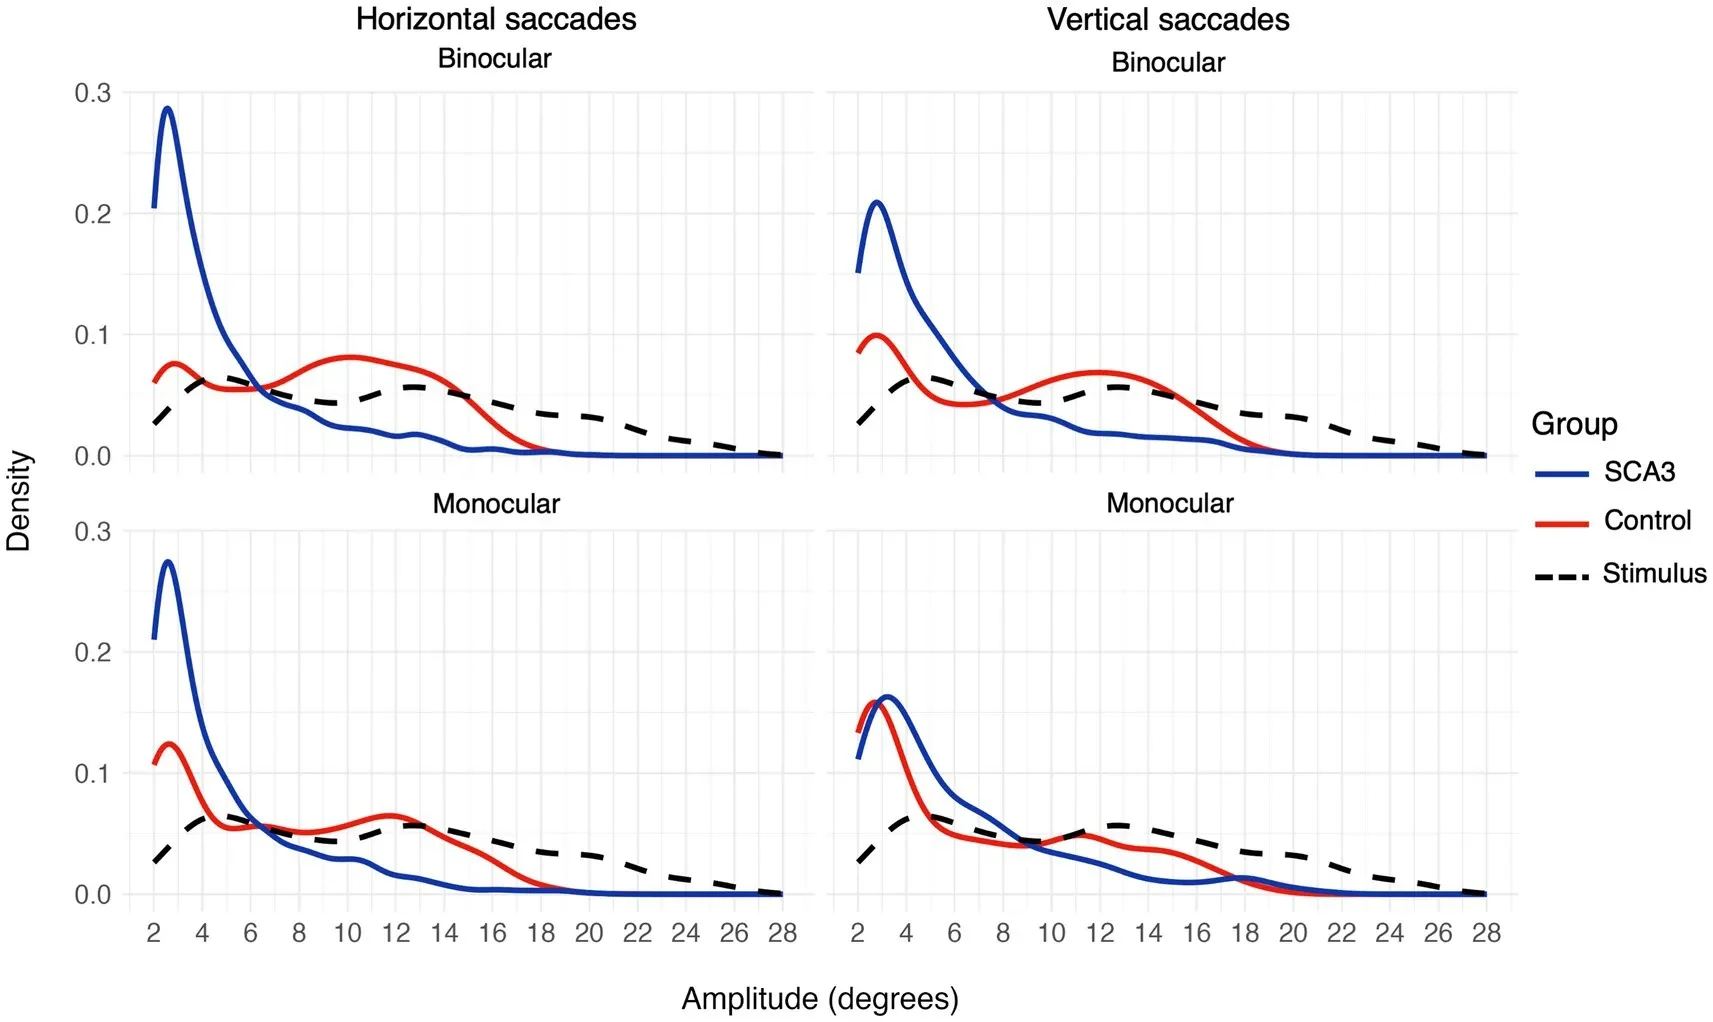
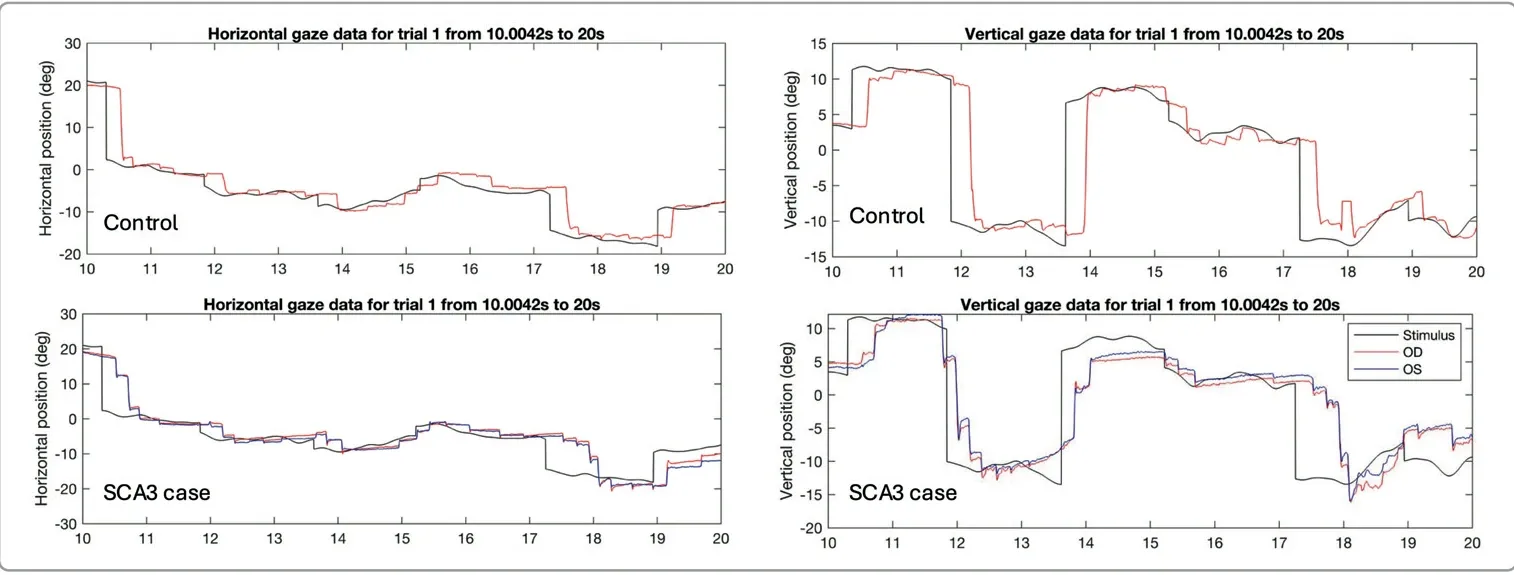
How they followed it was different. Their two eyes were not synchronised, with a larger positional difference between the eyes than in controls. And where a healthy observer captures a sudden jump of the target with one large saccade and a small correction, the SCA3 cases made a series of small, hypometric saccades to cover the same distance. The cover figure shows this directly in the raw traces. The saccadic amplitude distribution (first gallery figure) makes it quantitative: a sharp peak at small amplitudes for the patients, against a broad distribution matching the stimulus jumps for the controls. Many of these differences were significant for horizontal but not for vertical eye movements.
The shape of that amplitude distribution was related to the severity of the oculomotor disorder, which is what makes it a candidate biomarker.
What Comes Next
The authors conclude that eye tracking during a standardised task gives meaningful information on how eye movements are affected in SCA3 and can quantify the amount of disorder, and they propose the saccadic amplitude distribution and the positional difference between the eyes as potential biomarkers of severity. Longitudinal studies with more participants are the next step. This is one of the conditions in which the spatio-temporal analysis described on the Digital biomarker page is being investigated. The paper is open access.
Research: applications other than glaucoma are under investigation and are not part of SONDA’s cleared clinical use. SONDA is CE-marked as an aid in the diagnosis and staging of primary open-angle glaucoma.
Reference
- de Boer, M.J., Wasmann, R.A., Pott, J.W.R., Cornelissen, F.W., Jansonius, N.M. (2025). Continuous visual stimulus tracking to quantify eye motility in spinocerebellar ataxia type 3. Frontiers in Neurology, 16, 1650269. doi:10.3389/fneur.2025.1650269